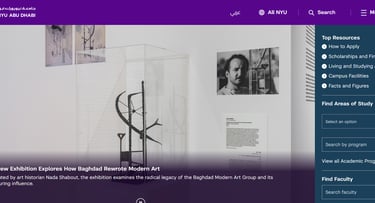
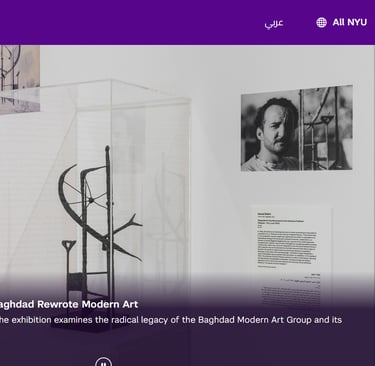
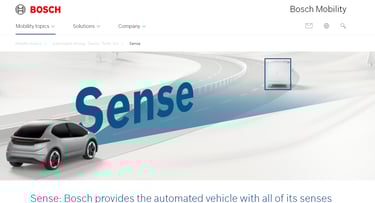
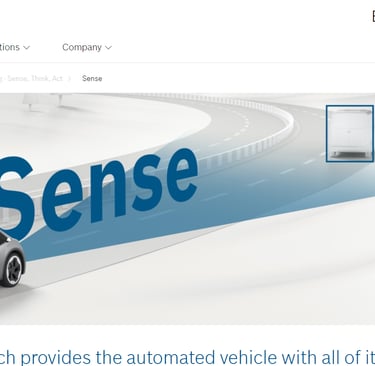
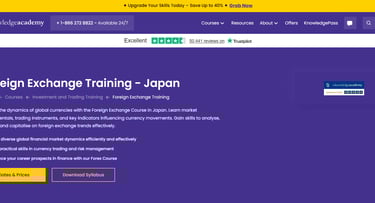
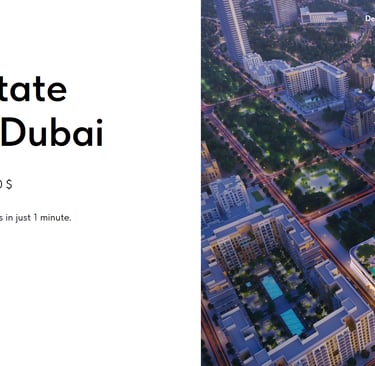
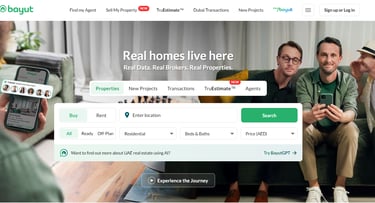
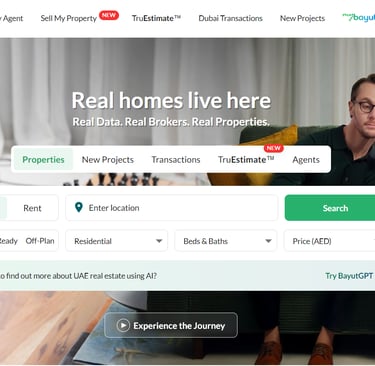
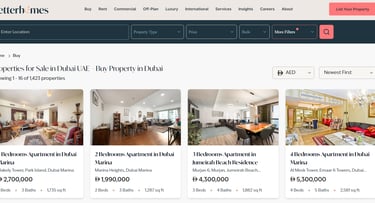
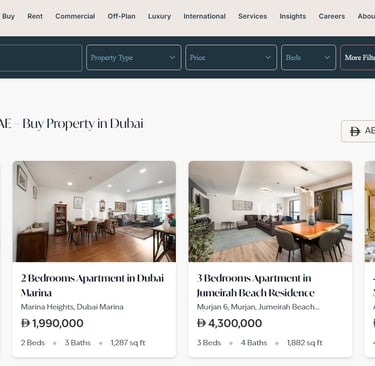
Gallery
A curated selection of research visualization projects


Who We Are
At digillex, we transform complex research data into clear, engaging visual stories that empower academic and scientific communities.


150+
15
Trusted Globally
Top Rated
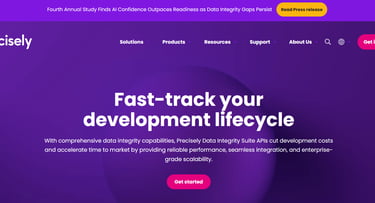
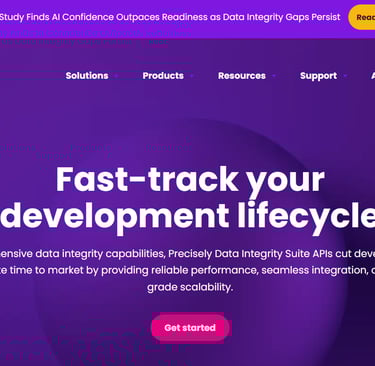
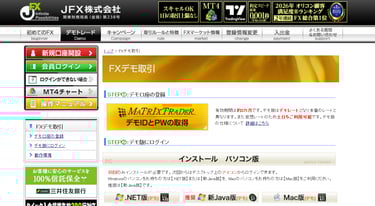
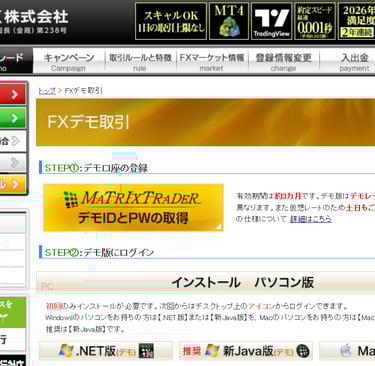
Our Services
Specialized solutions for research visualization and digital platforms.
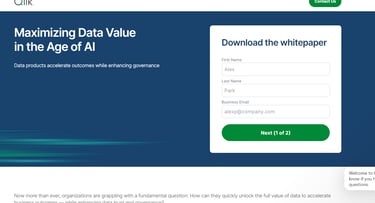
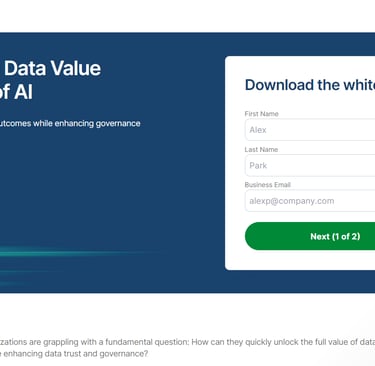
Data Viz
Crafting clear, insightful charts and infographics tailored to your data.


Web Apps
Developing responsive, user-friendly web applications for research needs.
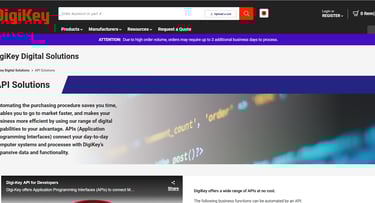
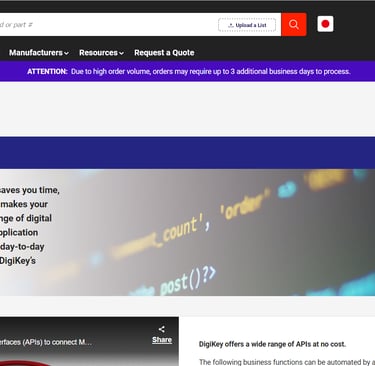
Integrating APIs seamlessly to enhance platform functionality and data flow.
API Work


Contact
Reach out for collaborations or questions
Phone
digillex@gmail.com
+81-90-5338-3638
© 2025. All rights reserved.


Web開発を中心に、コンテンツ設計、SEO最適化、ECサイト構築、ビジネスインテリジェンスまで幅広く対応しています。ユーザー視点の情報設計とデータ分析に基づき、成果につながるデジタル戦略を構築します。